what a great summary from pimco! and the key to understand the markets more on this topic super zusammenfassung! und der schlüssel zum verständnis der märkte. mehr zum themahttp://immobilienblasen.blogspot.com/search?q=buffethttp://immobilienblasen.blogspot.com/search?q=lbo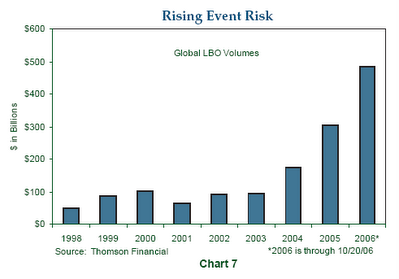 dank geht an tweedle-dee und ben http://thehousingbubbleblog.com/?p=1910#comments
U.S. Credit Perspectives / Credit Innovation and Opportunities http://tinyurl.com/y3ljk8
.....financial market innovation has shifted the status quo for individuals and corporations. Thanks to new products in the mortgage and credit markets, homebuyers and corporations can access capital like never before. And with the global economy growing and default rates at historically low levels, investors have been ready and willing to provide that capital.
However, with innovation comes risk. Uncharted waters have not yet been tested during turbulent times. If the U.S. economy slows sharply, today’s healthy risk appetites could quickly wither. Most likely, a deceleration in the economy will diminish the availability of capital, increase volatility, and apply downward pressure on asset prices by raising risk premiums in credit markets from today’s historically low levels.
Innovations in the Mortgage Market
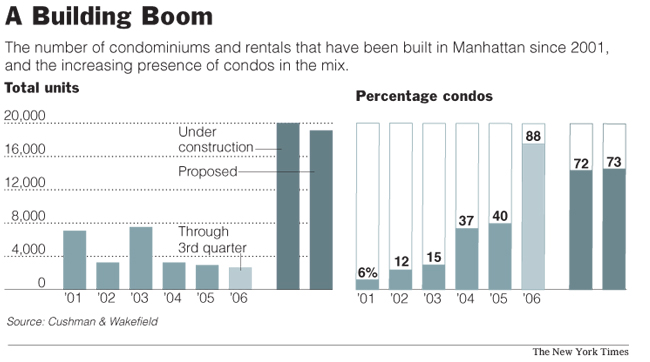
Innovations in the mortgage industry have made it easier than ever for homebuyers to acquire real estate. The home ownership rate in the United States today is at 69%, up 5% in the last 10 years ....mortgage industry’s ability to develop new products that keep initial monthly payments low, enabling consumers to buy homes they could not otherwise afford,(yes they can not afford this kind of houses!)....... Last year, ARMs represented 31.4% of total mortgage originations whereas in 2001 ARMs contributed only 10.2%1. Other examples of new mortgage products include mortgages with maturities up to 40 years, low or no down payments, reverse mortgages, and introductory teaser-rates. Creative financing kept housing accessible despite rising short-term interest rates.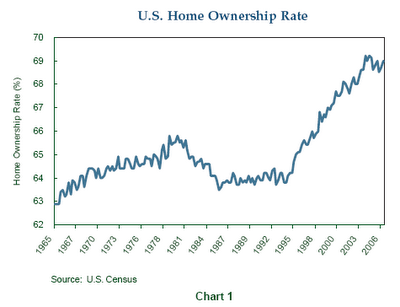
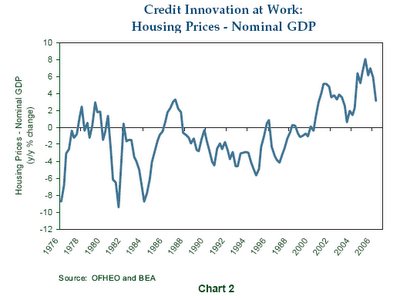
....... Consequently, due to innovation, disintermediation and leverage, housing prices have appreciated significantly faster than nominal GDP growth over the past several years
Ironically, despite a significant slowdown in housing price appreciation and soaring inventories2, credit availability for home buyers is only just beginning to tighten. Why? Investors remain focused on low default rates. In addition, abundant global liquidity continues to flow into the credit markets.....
Nevertheless, innovations in the mortgage market have brought a new and growing class of buyers, including sub-prime, adjustable-rate, and speculative borrowers, into the housing market. In all likelihood, these new players contributed to the rapid appreciation in the housing market over the past several years. However, if delinquencies and foreclosures rise, the prevalence of these marginal players will probably reduce risk tolerances. How the cooling housing market will impact the overall economy is still unclear.
What does seem clear to us is that the tightening of credit for homebuyers we are beginning to see is just that: the beginning. If we are correct, it follows that the influence of leverage and innovation on the housing market will turn and asset prices will be challenged.
Innovations in the Credit Market
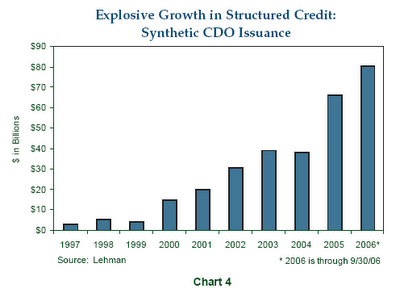
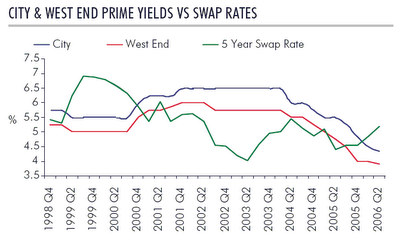
As new mortgage products transformed credit availability for homebuyers, credit market innovations have also influenced corporate bond spreads. Credit default swaps (CDS) have grown such that the notional value of all outstanding CDS is now three times larger than the cash corporate bond market (Chart 3). As a result of growing liquidity in the CDS market, corporate bond collateralized debt obligations (CDOs) are increasingly replaced by synthetic CDOs, which are funded with CDS contracts as opposed to cash bonds. ....... Placated by historically low default rates, investors are now comfortable taking on more structured credit risk......

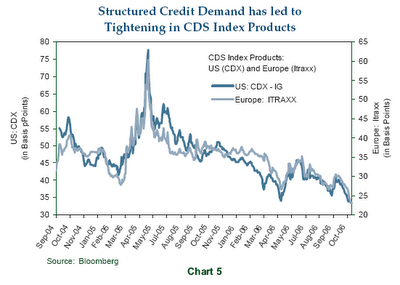
 Does credit innovation carry risks? Yes. As we have seen with housing, new home buyers can be lured into buying homes they cannot afford. Ultimately, rising defaults and restricted credit availability will negatively affect the housing market, foreshadowing what is also in store for the credit market. ......... These products (cds, cdo´s, cpdo´s....) and markets are relatively new and, more importantly, have yet to be tested in a bear market. Leverage has been pushed to the point that corporate bonds, and particularly CDS securities, may have limited upside potential going forward. In fact, the explosive growth in leveraged structured credit products globally is likely a main catalyst behind the dramatic tightening in the major U.S. and European credit default indices (CDX and iTraxx) where credit spreads have now reached new tights (Chart 5). We are clearly in uncharted waters.
rest is tied to their tradingstrategies of bonds and derivatives........
Labels: derivatives, lbo, pimco, stresstest


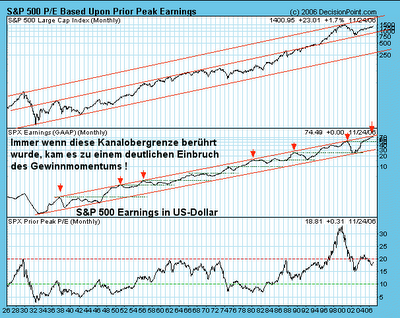
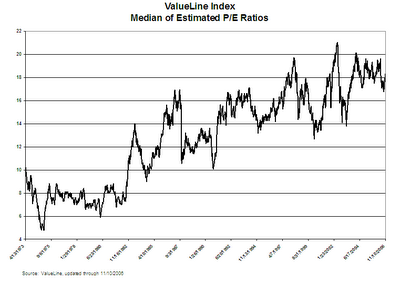
 As it happens, the simple, normalized earnings yield on the S&P 500 has been a remarkably good indicator of subsequent 20-year total returns for the stock market. In the chart below, I take the inverse of the price/peak-earnings ratio as a “normalized” earnings yield. Recall also that peaks in S&P 500 earnings over the past century have been well contained by a 6% annual growth trendline. (Finding that level today is easy. To quote Madge in the Palmolive commercial; “you're soaking in it”). In order to further normalize the earnings yield, I've added the amount of annualized earnings growth that would be required to bring the prevailing peak-earnings figure earnings at any point in time up to that 6% growth trend.


 größer/bigger
 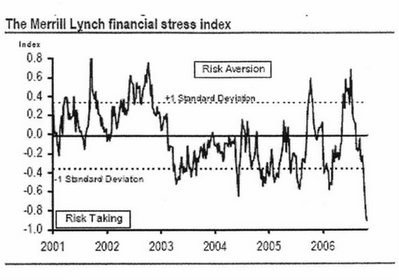 größer/bigger
 ![[Most Recent Quotes from www.kitco.com]](http://www.kitconet.com/charts/metals/gold/t24_au_en_usoz_2.gif)
![[Most Recent Quotes from www.kitco.com]](http://www.kitconet.com/charts/metals/gold/t24_au_en_euoz_2.gif)


